In today’s publication, I would like to focus on an important element, which is the calculation of production costs. In this area, the functionality of SAP Business One is very limited. That’s why in our integrated CompuTec ProcessForce solution, dedicated to advanced production, we have created a separate tool. This functionality is called “costing.”
From the very beginning, in the construction of this mechanism, we refer to areas that are the main elements of cost information creation. I am thinking here about the Item valuation methods, which define how to settle the value of stock and calculate the value for the quantities released for production, as well as in calculating the Bill of Materials (BOM) and Manufacturing Order (MO) value. At the moment, there are four methods of Item valuation available: Moving Average, Standard, FIFO, and Batch/Serial. The next key element is Cost Categories, which determine not only current but also future valuations of Items, including all the BOM details. Thanks to this category, it is possible to collect current information as well as to modify it freely. For a full view, it is also possible to add and divide the Overhead Costs in terms of fixed and variable.
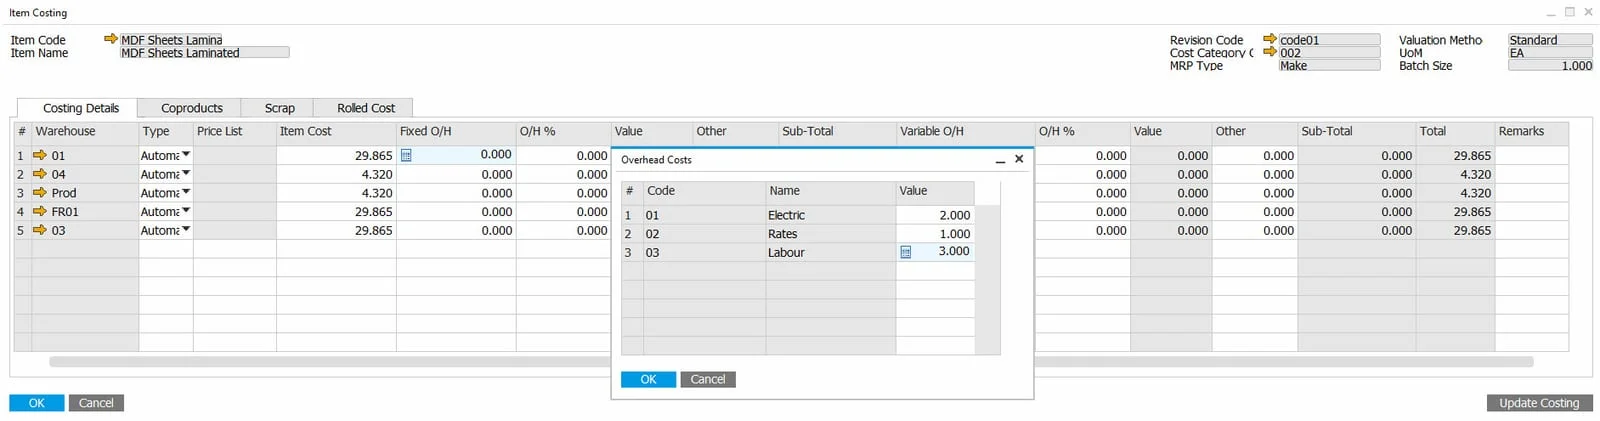
As you can see in the picture above, the system is very flexible when it comes to cost management. You can both add value and cost to be included in the calculations. An important element is that the system, after setting up a new Item or Resource, creates a standard Cost Category “000” record for it each time. However, it is possible to create any number of Cost Category variants. All Cost Categories created are also generated for each of the Item’s Revisions. This gives even greater possibilities for later management. A similar situation exists for Resources; however, the main determinant is the type of time to which the cost will be allocated, i.e., Queue Time, Setup Time, Run Time, and Stock Time. As far as Resource accounting is concerned, it is also possible to post individual Resource costs by type of time to other accounts.
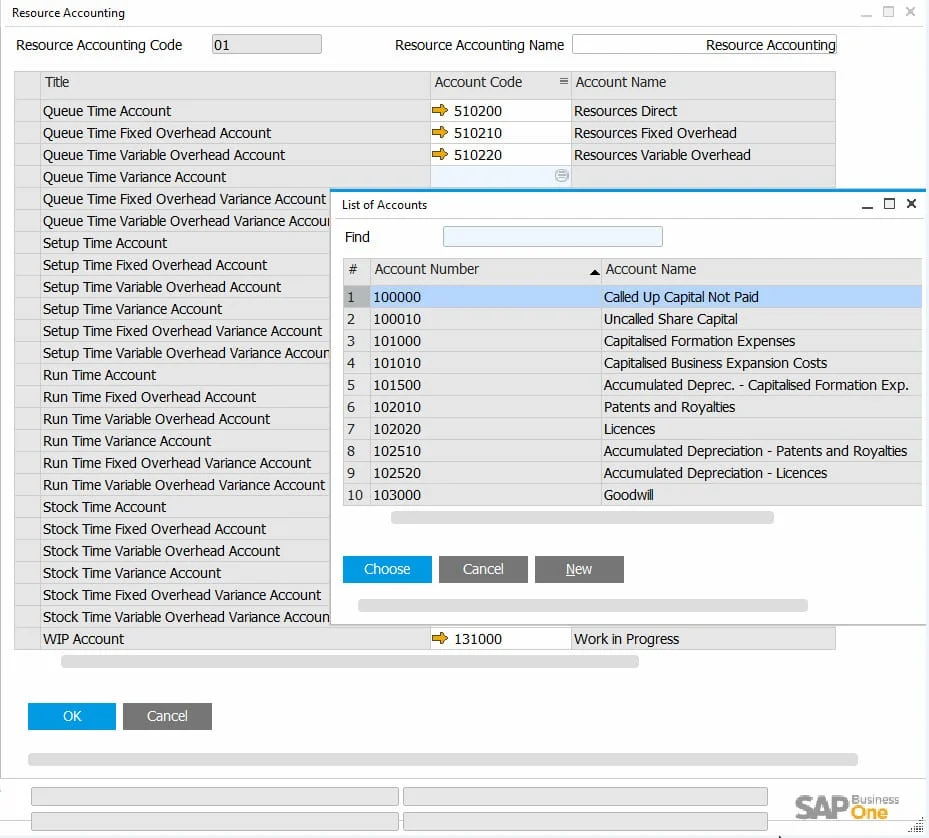
This gives you the opportunity to freely analyze the Cost of these Resources. In order to collect information on the costs of individual Items or finished products, a tool was created for their roll-up according to the structure of their share. This allows us to prepare our calculations accordingly, taking into account only the information that was to be found there.
In the next part, I would like to go into the BOM and Manufacturing Order cost. In this area, Cost Categories as well as the cost-sharing structure play a key role. The standard Cost Category is the base. As a result, its proper preparation gives a full view of the real cost of production.
Below you can find information about the cost of a BOM.
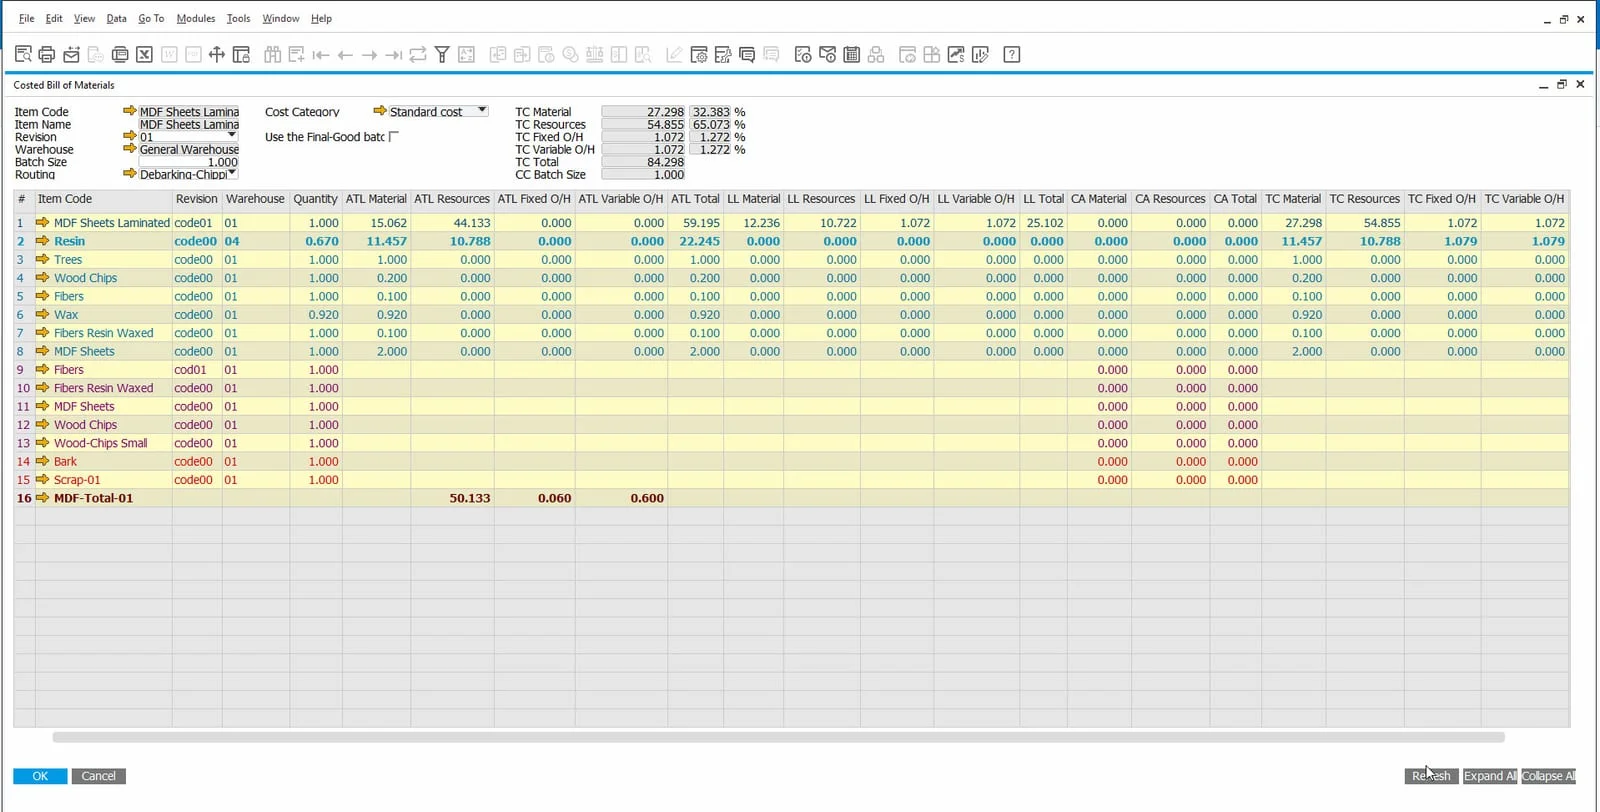
As you can see in the picture, all components, such as the Cost of raw materials, Coproducts, Scraps, and of course the Resources that were used, can be included. The structure is divided into three groups: ATL (At This Level), containing the set of costs for raw materials and Resources; LL (Low Level), dedicated to the costs of semi-finished products; and CA (cost allocation), for Coproducts and Scraps. The system also shows the costs in the summary by their type and percentage of the value of the finished product. With the Cost Category field at the top of the image, you can see the value over time, or you can make a valuation according to a previously agreed category. The calculation may also take into account the Costing, including the Revision and its size. Use of these mechanisms allows you to quickly calculate the cost of production.
The next element is the calculation of the Manufacturing Order, which you can check below.
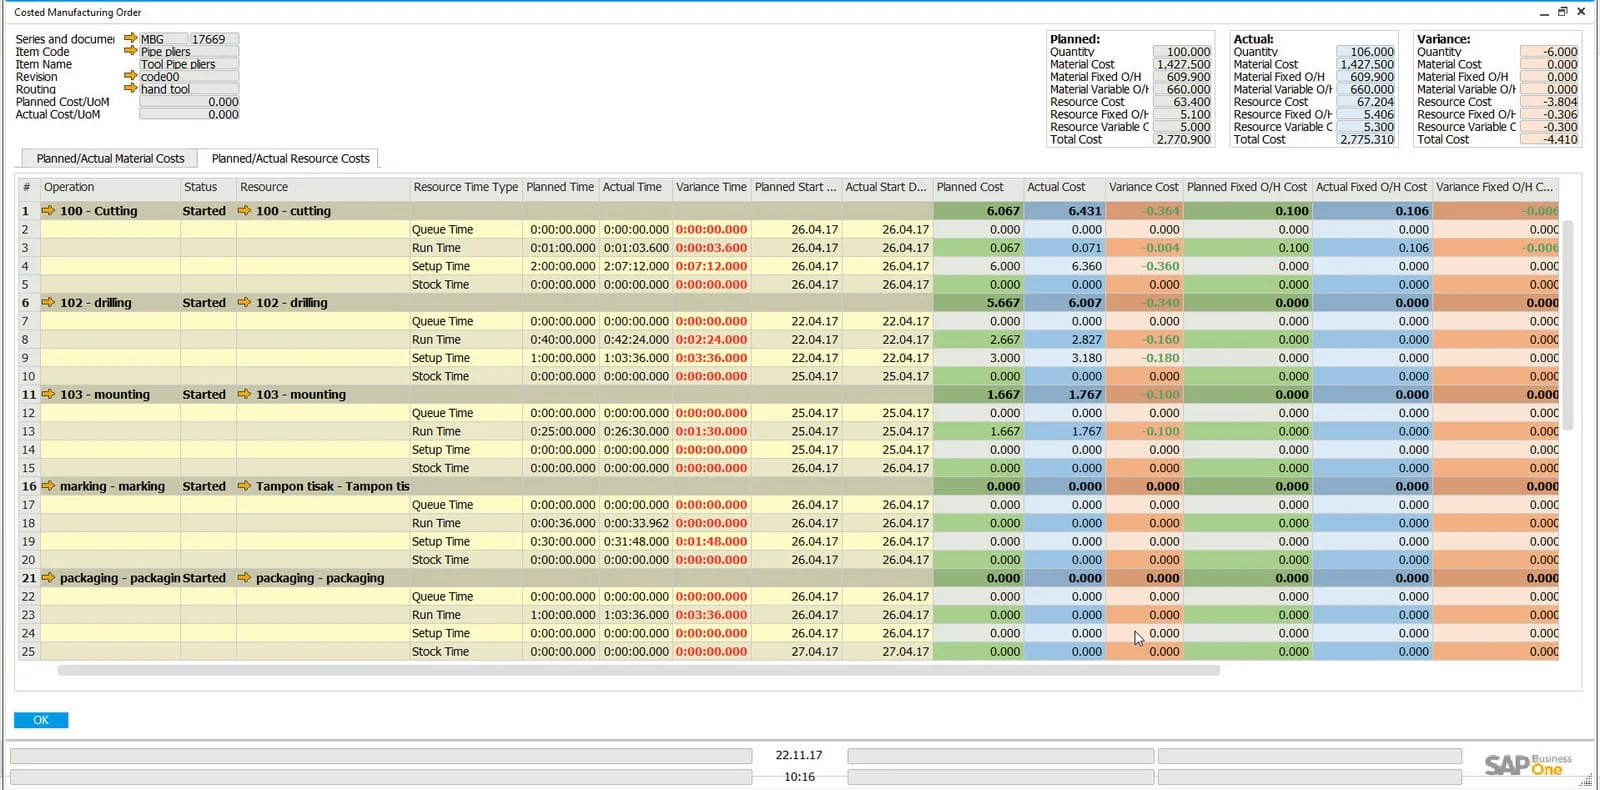
This view shows discrepancies between the planned cost for a specific Manufacturing Order and the real consumption of materials and the actual time that was used for its completion. After the comparison of these values, the system presents discrepancies as well as all values in detail: in the first tab, for all materials that were used, and in the second one, presented in the picture, for the settlement of the actual time from the Routing, divided into the costs of Operations and Resources. This tool allows you to view the costs of Orders and, based on their analysis, take possible corrective actions, in particular regarding the effectiveness of using all elements.
In conclusion, I would like to show how all the values and mechanisms discussed above can be used in production efficiency reporting. This can be illustrated by the picture below, showing a section of the production efficiency report in relation to the planned and current costs for all components and their elements.
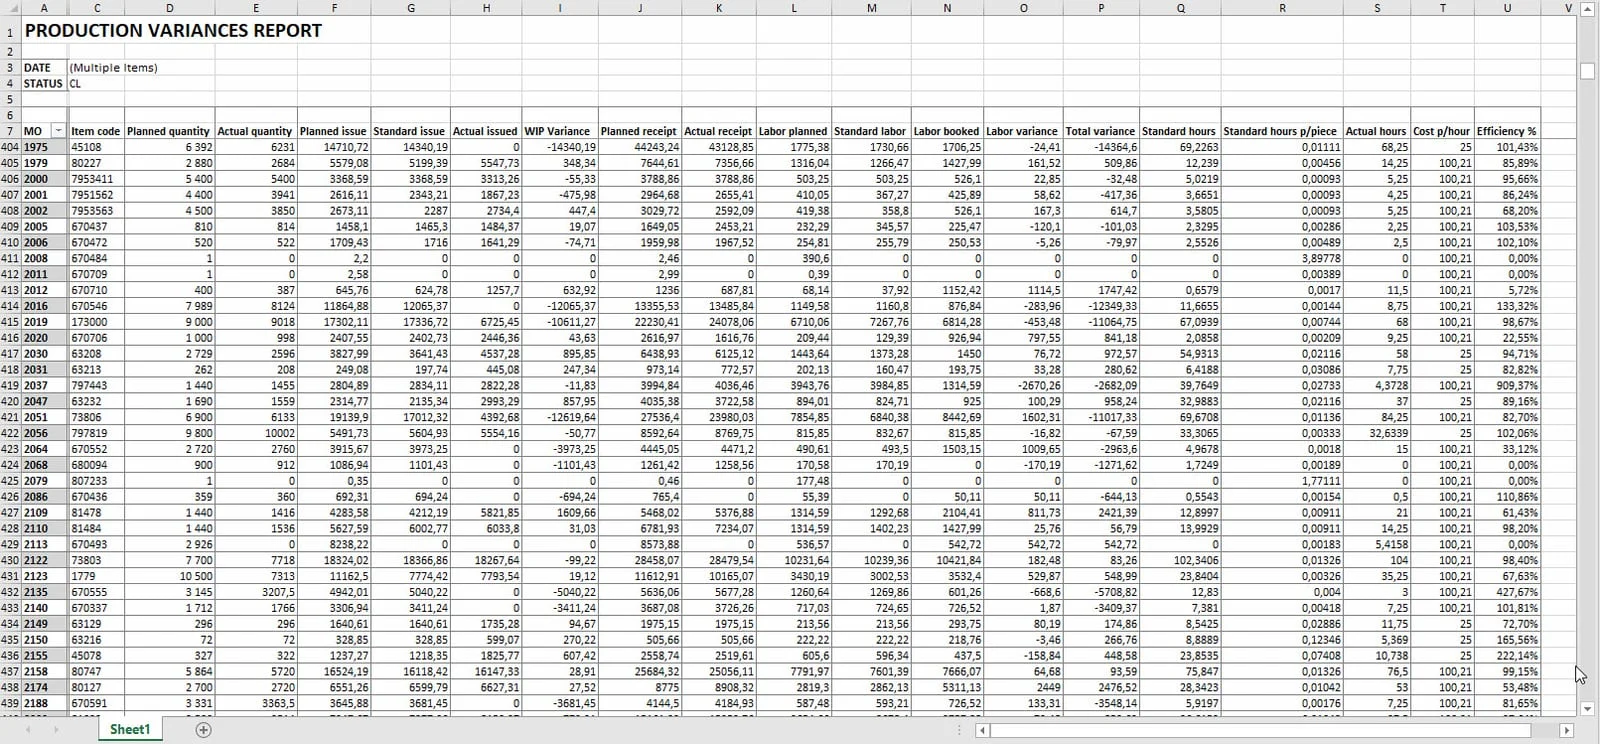
The above report is just an example of how the values expected by production can be calculated. However, please note that using SAP Crystal Reports, which was used to prepare this report, we can build any reports necessary for the analysis and optimization of production in enterprises. A report can also be made available to other users with the option to update it, and users can also build their own view of the contained data in real time.
The main goal of this publication is to show that CompuTec ProcessForce is not only a solution for advanced production processes, but also for cost-effective and comprehensive production costing. Obviously, the capabilities offered by CompuTec ProcessForce are far broader, and today’s publication just showed one of its areas.