/Solutions/ Features
Reporting & Analytics
CompuTec solutions capture production, quality, and operational data within SAP Business One, making it accessible for analysis, reporting, and informed decision-making across the organization.
- Analytical Pages
- KPI Dashboards
- Compliance Reports
- Production & Costing Analytics

From Operational Data to Informed Decisions
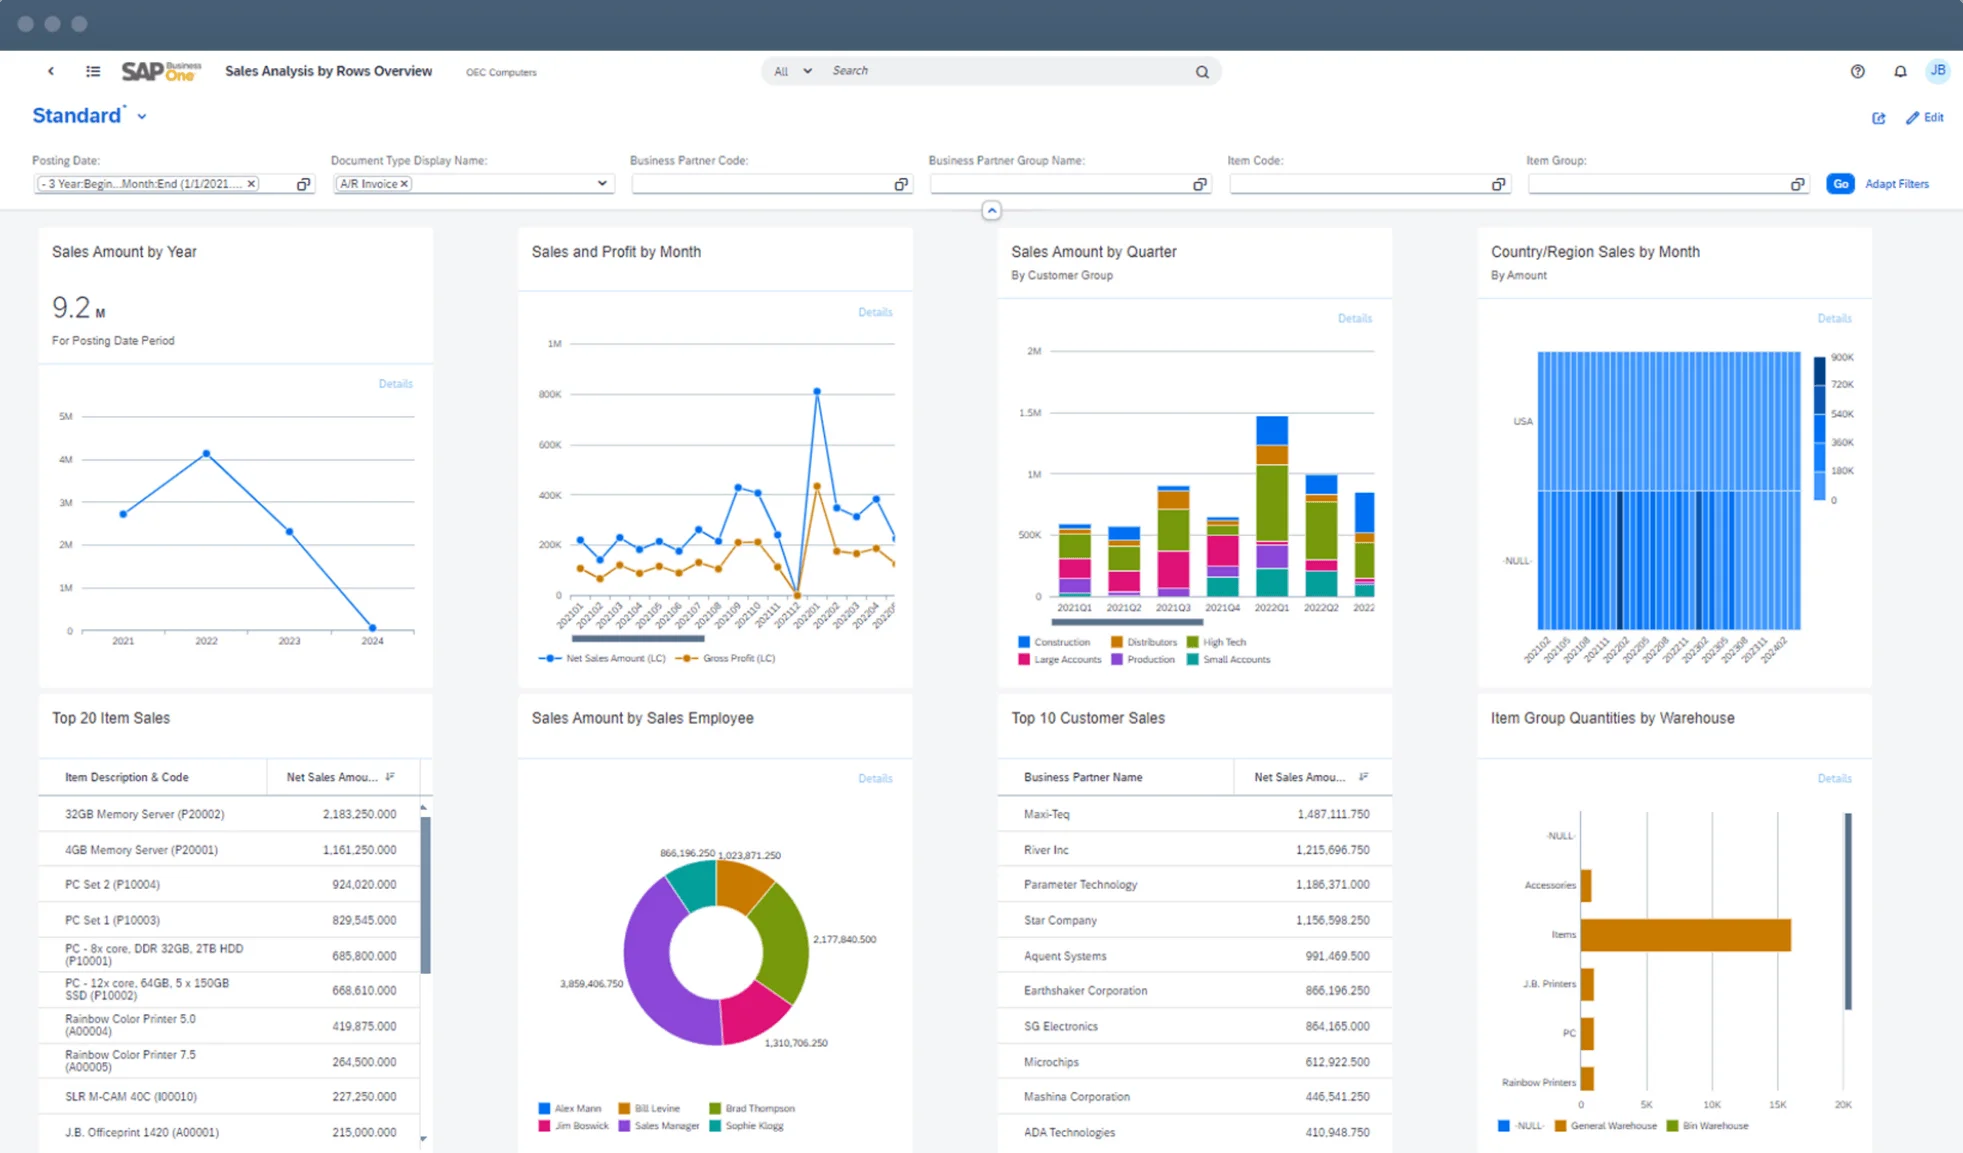
Flexible analytical pages, formatted reports, and live dashboards make production, quality, and cost data accessible to the people who need it, giving managers visibility of production performance, quality teams the documentation they need, and finance cost data grounded in what actually happened.

How Better Data Leads to Better Decisions
Production Performance Analysis
- Know Where Production Stands: Comparing planned and actual times and quantities shows where production is on track and where attention is needed.
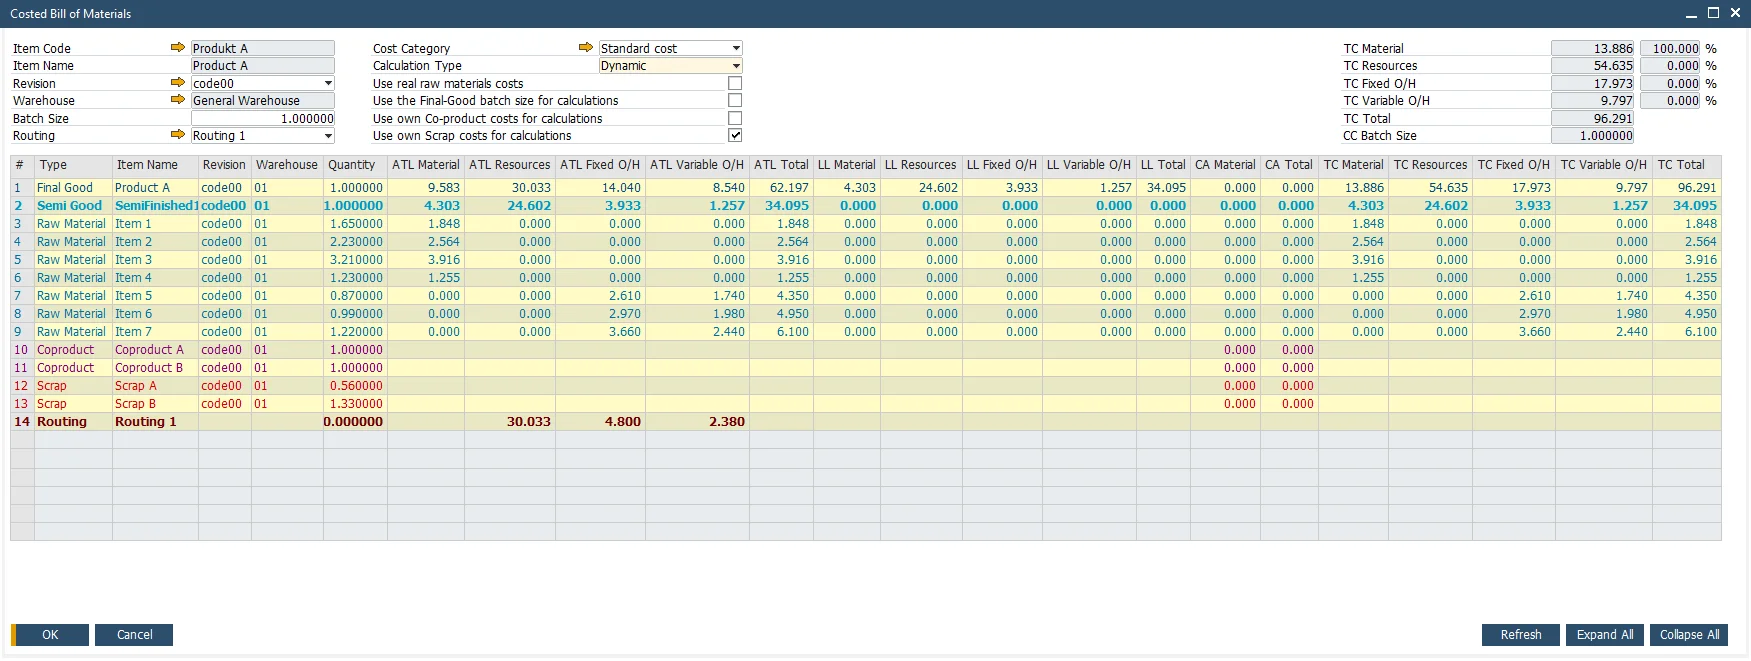
- Understand the True Cost of Production: Actual material, resource, and overhead data per order gives finance and operations a reliable basis for cost analysis and pricing decisions.
- Identify Where Waste Occurs: Yield and scrap data across production runs highlights where material efficiency can be improved and where losses are higher than planned.
Quality and Compliance Reporting
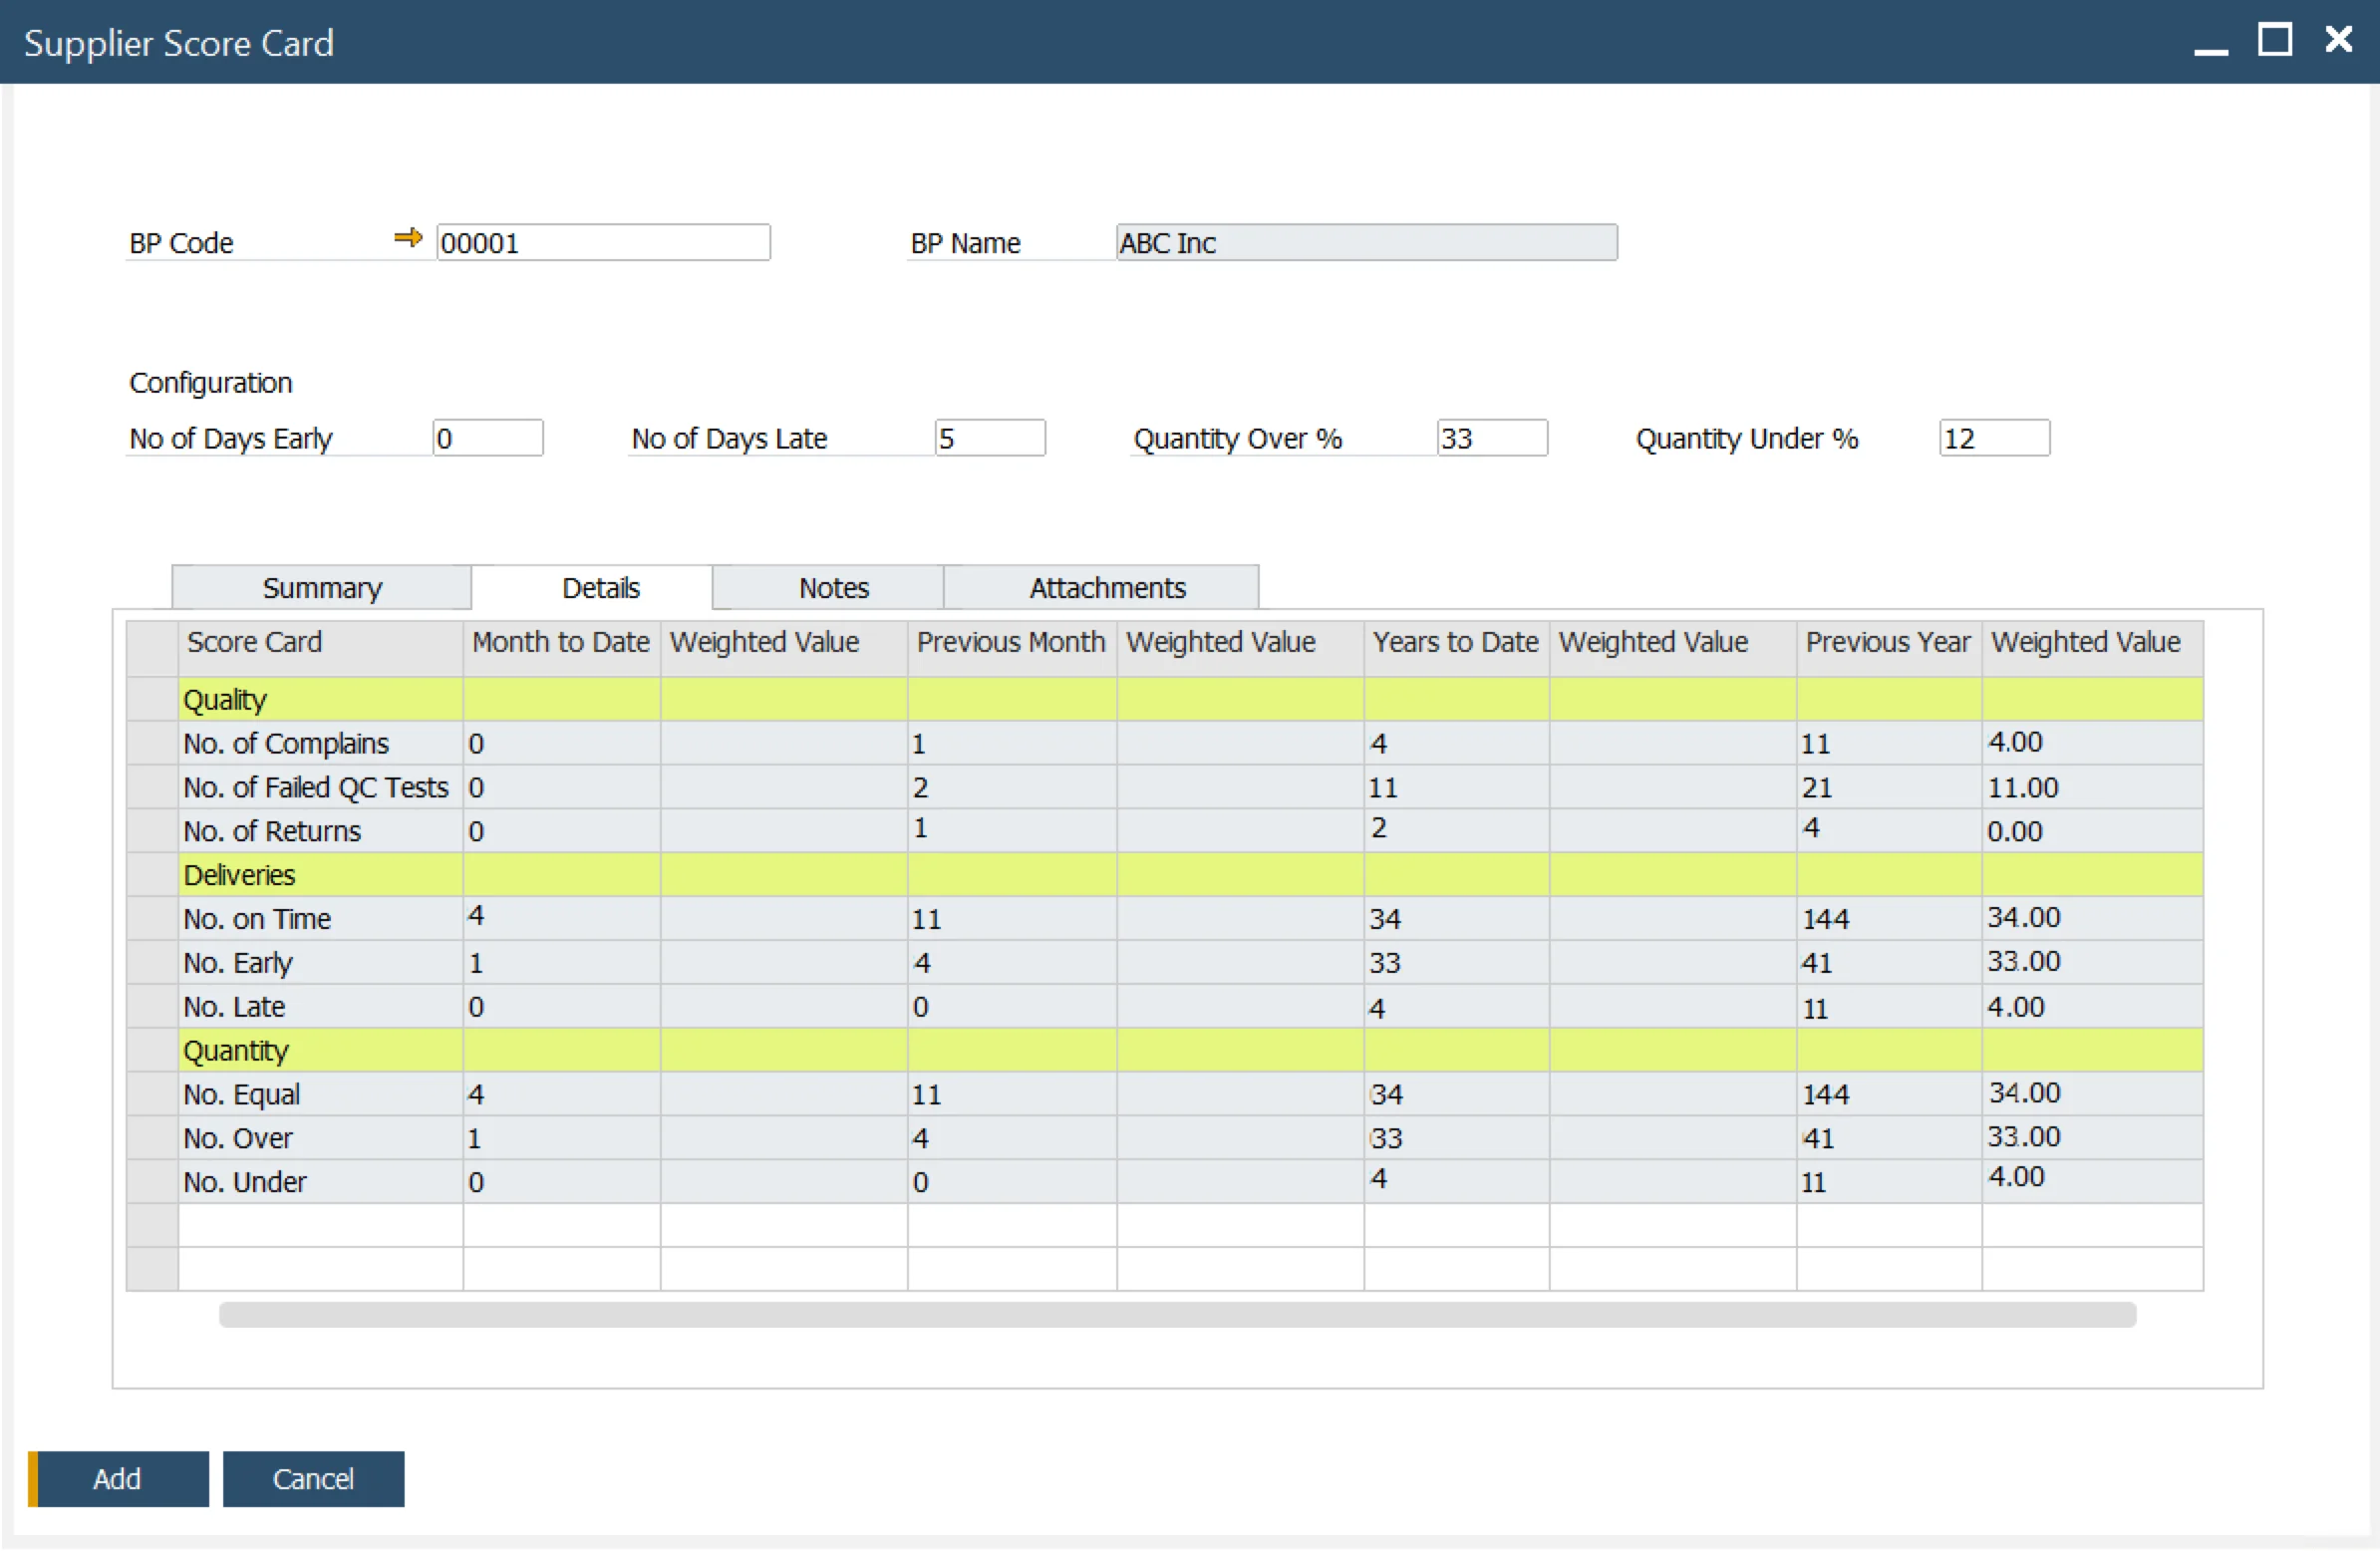
- Quality Evidence When You Need It: Certificates of Analysis, NCMRs, and Supplier Scorecards are generated from live data, ready for customers, auditors, or internal review.
- Spot Quality Trends Early: Non-conformance data recorded over time makes it possible to identify recurring quality issues before they become persistent problems.
- Evaluate Suppliers Objectively: The Supplier Scorecard gives procurement teams a documented, data-driven basis for supplier decisions rather than relying on experience alone.
Flexible Data Exploration
- The Right Data for Each Role: Report variants configured per user or team mean everyone works from the data most relevant to their responsibilities.
- Data Presented Clearly: Tables plus bar, column, pie, and line charts make it straightforward to communicate findings to different audiences.
- Reports Built on Any Data: Analytical pages can draw on any data source available in the environment, so reporting is not limited to pre-built formats.
Data Shared Across the Organization
- Accessible from Any Device: Browser-based analytical pages can be viewed on any device, giving managers access to production data wherever they are.
- Consistent Views Across Teams: Named report variants shared across the organization mean teams work from agreed, consistent views of the same data.
- One Source of Truth: All CompuTec solutions write to the same SAP Business One database, so every report reflects the same underlying data.
Explore Our Analytics Capabilities
CompuTec AppEngine Analytics
Build, configure, and share analytical reports based on data from CompuTec AppEngine SAPUI5-based apps, using a flexible, browser-based analytics functionality.
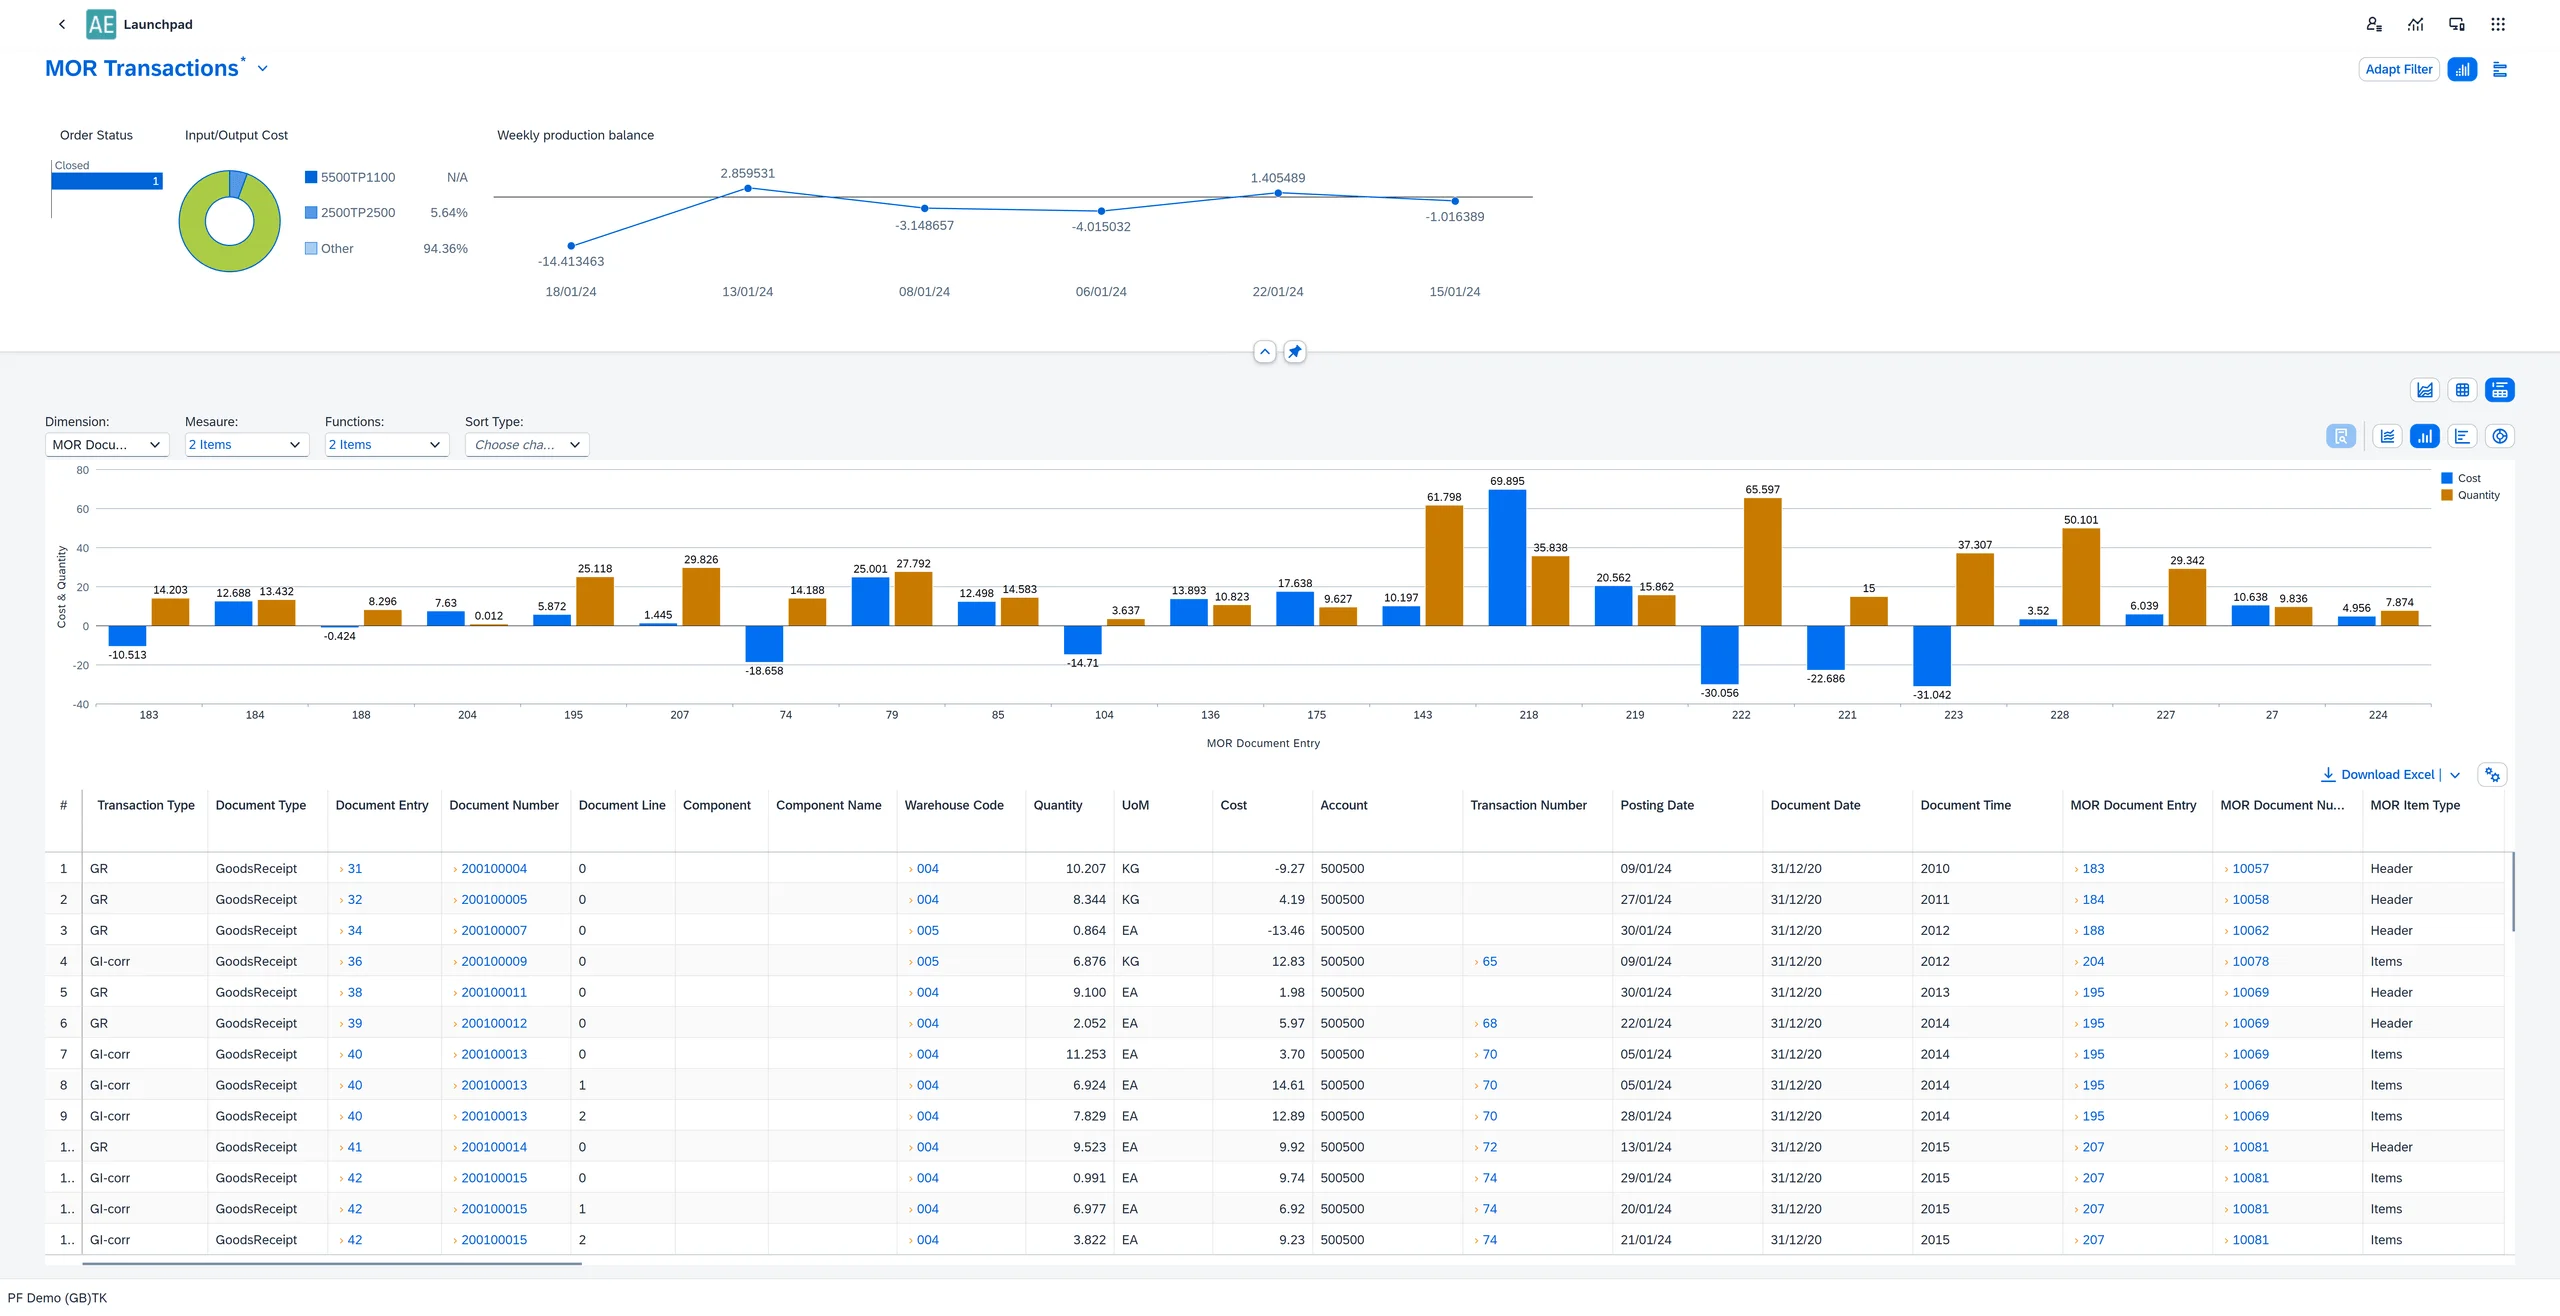
CompuTec AppEngine | Analytical Page
Data Sources
Installing a CompuTec AppEngine app adds predefined data sources automatically, giving a ready-to-use foundation for reports on that app's data. Beyond those, analytical pages can be built on SQL queries, OData endpoints, or imported JSON, so reports can cover any data available in your environment.
Filters and Microcharts
Reports filter on text, numbers, dates, date and time, or a defined collection of values, with operators such as contains, between, and greater than. Microcharts act as filters in their own right, so clicking a segment narrows the report to what it represents.
Flexible Visualization
Data can be displayed as tables or visualized as bar, column, pie, or line charts, with sum, average, minimum, and maximum applied to numeric columns. Columns can be frozen while scrolling, rows grouped, and totals shown per column. Where a column is linked, clicking a value opens the related record in SAP Business One, so the document behind any number is one click away.
Variants and Permissions
Report configurations are saved as named variants, each with its own filters, columns, and visualization settings. Variants can be kept private to their author, published to everyone, or granted to named users and groups as full or read-only access.
Insights to Action
Business operations can be run directly from selected rows without leaving the report. Which actions appear is set per variant, so a production variant can show actions that a warehouse variant hides.
Export and Print
Tables and charts export to Excel, and reports can be previewed and printed as PDFs generated from SAP Crystal Reports templates, with several selected rows combined into a single document where the report supports it.
Extensible by Partners and Customers
CompuTec partners and customers who build their own CompuTec AppEngine applications can create corresponding analytical pages for their custom app data, extending the analytics capability to cover their specific business requirements.
- Documentation Center (opens in new tab)
View CompuTec ProcessForce documentation
- Documentation Center (opens in new tab)
View CompuTec AppEngine documentation
Advantages for Your Industry
Yield losses, cost per run, client billing. What you need your reports to answer depends on your industry.

Want to see what analytical reporting looks like across CompuTec solutions?
Every CompuTec solution writes to the same SAP Business One database, so production, quality, warehouse, and shop floor data can be reported on together rather than pulled from separate systems. Take a closer look at CompuTec ProcessForce and CompuTec AppEngine, or ask for a demo of the reporting in action.
Frequently Asked Questions
What is CompuTec AppEngine Analytics?
CompuTec AppEngine Analytics is a browser-based analytics functionality that allows users to build, configure, and share analytical reports. Custom reports can also be created using SQL queries, OData endpoints, or JSON data sources. Report configurations can be saved as named variants and shared across the organization. Because it runs in the browser, analytical pages work on any device, including tablets and phones.
Can I open the underlying SAP Business One record from a report?
Yes. Where a column is linked, clicking a value in an analytical page opens the related record in SAP Business One, so the document behind any figure is one click away rather than something to look up separately.
Can reports be exported or printed?
Yes. Tables and charts export to Excel, and reports can be previewed and printed as PDFs generated from SAP Crystal Reports templates. Where a report supports it, several selected rows can be combined into a single PDF.
Can business operations be run directly from a report?
Yes. Actions can be run against selected rows without leaving the report. Which actions appear is configured per variant, so a production variant can show actions that a warehouse variant hides.
Can report access be controlled per user?
Yes. CompuTec AppEngine Analytics includes a permissions system that controls who can see and use each report variant. Variants can be kept private to their author, published to everyone, or granted to named users and groups as full or read-only access.
What SAP Business One reporting tools work with CompuTec data?
CompuTec solution data is fully accessible through SAP Business One's native reporting tools, including SAP Crystal Reports, Excel integration via a live SAP HANA connection, the built-in Query Manager, and KPI widgets and cockpit dashboards. SAP Analytics Cloud is also compatible (not included in the standard SAP Business One license).
What quality reports does CompuTec ProcessForce generate?
CompuTec ProcessForce generates Certificates of Analysis from quality control test results, Non-Conforming Materials Reports documenting quality failures and corrective actions, Quality Control Test Reports covering results across items, batches, and warehouses, and Supplier Scorecards evaluating supplier performance across quality, delivery, and timeliness.
What is the Costed BOM in CompuTec ProcessForce?
The Costed BOM provides a financial view of the full product structure, with costs broken down at each BOM level for materials, resources, and overheads. It can be calculated for specific batch sizes and using current raw material prices from SAP Business One, giving manufacturers an accurate picture of what each product costs to make.
What are Cost Categories in CompuTec ProcessForce?
Cost Categories allow multiple cost scenarios to be defined alongside the standard production cost. Alternative scenarios, such as different supplier prices or alternative formulations, can be modeled in a separate Cost Category and compared without affecting live production valuations.
Can planned and actual production times be compared?
Yes. Time booking data recorded via CompuTec PDC can be compared against planned operation times from the routing, showing where production took longer or shorter than planned. This data is also used in the Costed Manufacturing Order Report for accurate production cost analysis.
Our Solutions & Services
Fully integrated, AI-ready solutions for SAP Business One, plus the implementation, hosting and support to run them.













Bill of Materials & Routings
Product & Process Definition
Product Costing
Cost Rollup & Calculation
MRP II & Scheduling
Material & Capacity Planning
Production Execution & Control
Manufacturing Order Execution
Quality Control & Complaints
Quality Tests & Non-Conformances
Traceability & Compliance
Batch Traceability & Audit Trail
Plant Maintenance
Equipment Maintenance Planning
GS1 & Logistics
GS1 Barcodes & Label Automation
Reporting & Analytics
Analytical Pages & Dashboards
Blog
From technical updates to industry trends — stay informed with the latest feature releases, expert business insights, and upcoming global events.

Events & Webinars
Join Us in Amsterdam This October
CompuTec brings news on AI and the SAP Business One Web Client to two back-to-back partner events in Amsterdam, October 19–22, 2026.

SAP Business One
CompuTec WebUp Now Covers the Latest SAP Business One 10.0 Web Client Views

CompuTec WMS
Custom Row Colors and More in CompuTec WMS 3.2608.1

Events & Webinars
The Web Client-First Era: SAP Business One Version 11, AI, and the CompuTec Roadmap

CompuTec ProcessForce
Focusing on the Next Generation