CompuTec AppEngine Soars to New Heights with OpenTelemetry Instrumentation!
With the release of CompuTec AppEngine 3.0, we’re excited to offer a powerful new feature that will give you unprecedented insight into the performance and health of your CompuTec solution deployments: support for OpenTelemetry, which can be used with many observability vendors like Grafana!
What is OpenTelemetry? Unlocking the Secrets of Your Systems
OpenTelemetry is the standardized collection and transmission of application behavior data from remote points to a central receiving station for monitoring and analysis. Think of it as the vital signs of your application and infrastructure. This data can include a wide range of signals, such as:
- Metrics: Numeric measurements sampled over time (e.g., request latency, CPU or memory usage) that reveal what is happening and how it trends.
- Traces: End-to-end records of a single request’s path, showing where time is spent.
- Logs: Timestamped, free-form events—errors, warnings, info—that capture what happened at a specific moment.
By continuously gathering this data, you gain a real-time and historical view of how your systems are operating. This proactive approach allows you to identify potential issues before they impact your users, optimize performance, and gain valuable insights into your system’s behavior.
Why is CompuTec AppEngine OpenTelemetry a game-changer?
CompuTec AppEngine’s support for OpenTelemetry can bring a wealth of business benefits to any organization using CompuTec solutions, including:
Enhanced Performance and Reliability: Real-time monitoring allows you to quickly identify performance bottlenecks, resource constraints, and potential failures. This enables faster troubleshooting and proactive optimization and ultimately leads to more stable and reliable applications.
Improved User Experience: By understanding application performance and identifying issues before they escalate, you can ensure a smoother and more responsive user experience, which translates to increased satisfaction and productivity.
Faster Mean Time To Resolution (MTTR): When issues do arise, comprehensive telemetry data provides the context needed to diagnose the root cause quickly and efficiently. This significantly reduces downtime and minimizes the impact on business operations.
Data-Driven Decision Making: OpenTelemetry provides valuable insights into applications’ use and performance under different conditions. This data can inform capacity planning, infrastructure investments, and application development decisions.
Proactive Problem Detection: Setting up alerts based on key metrics allows you to be notified of potential issues before they become critical. This proactive approach enables you to take preventative measures and avoid costly outages.
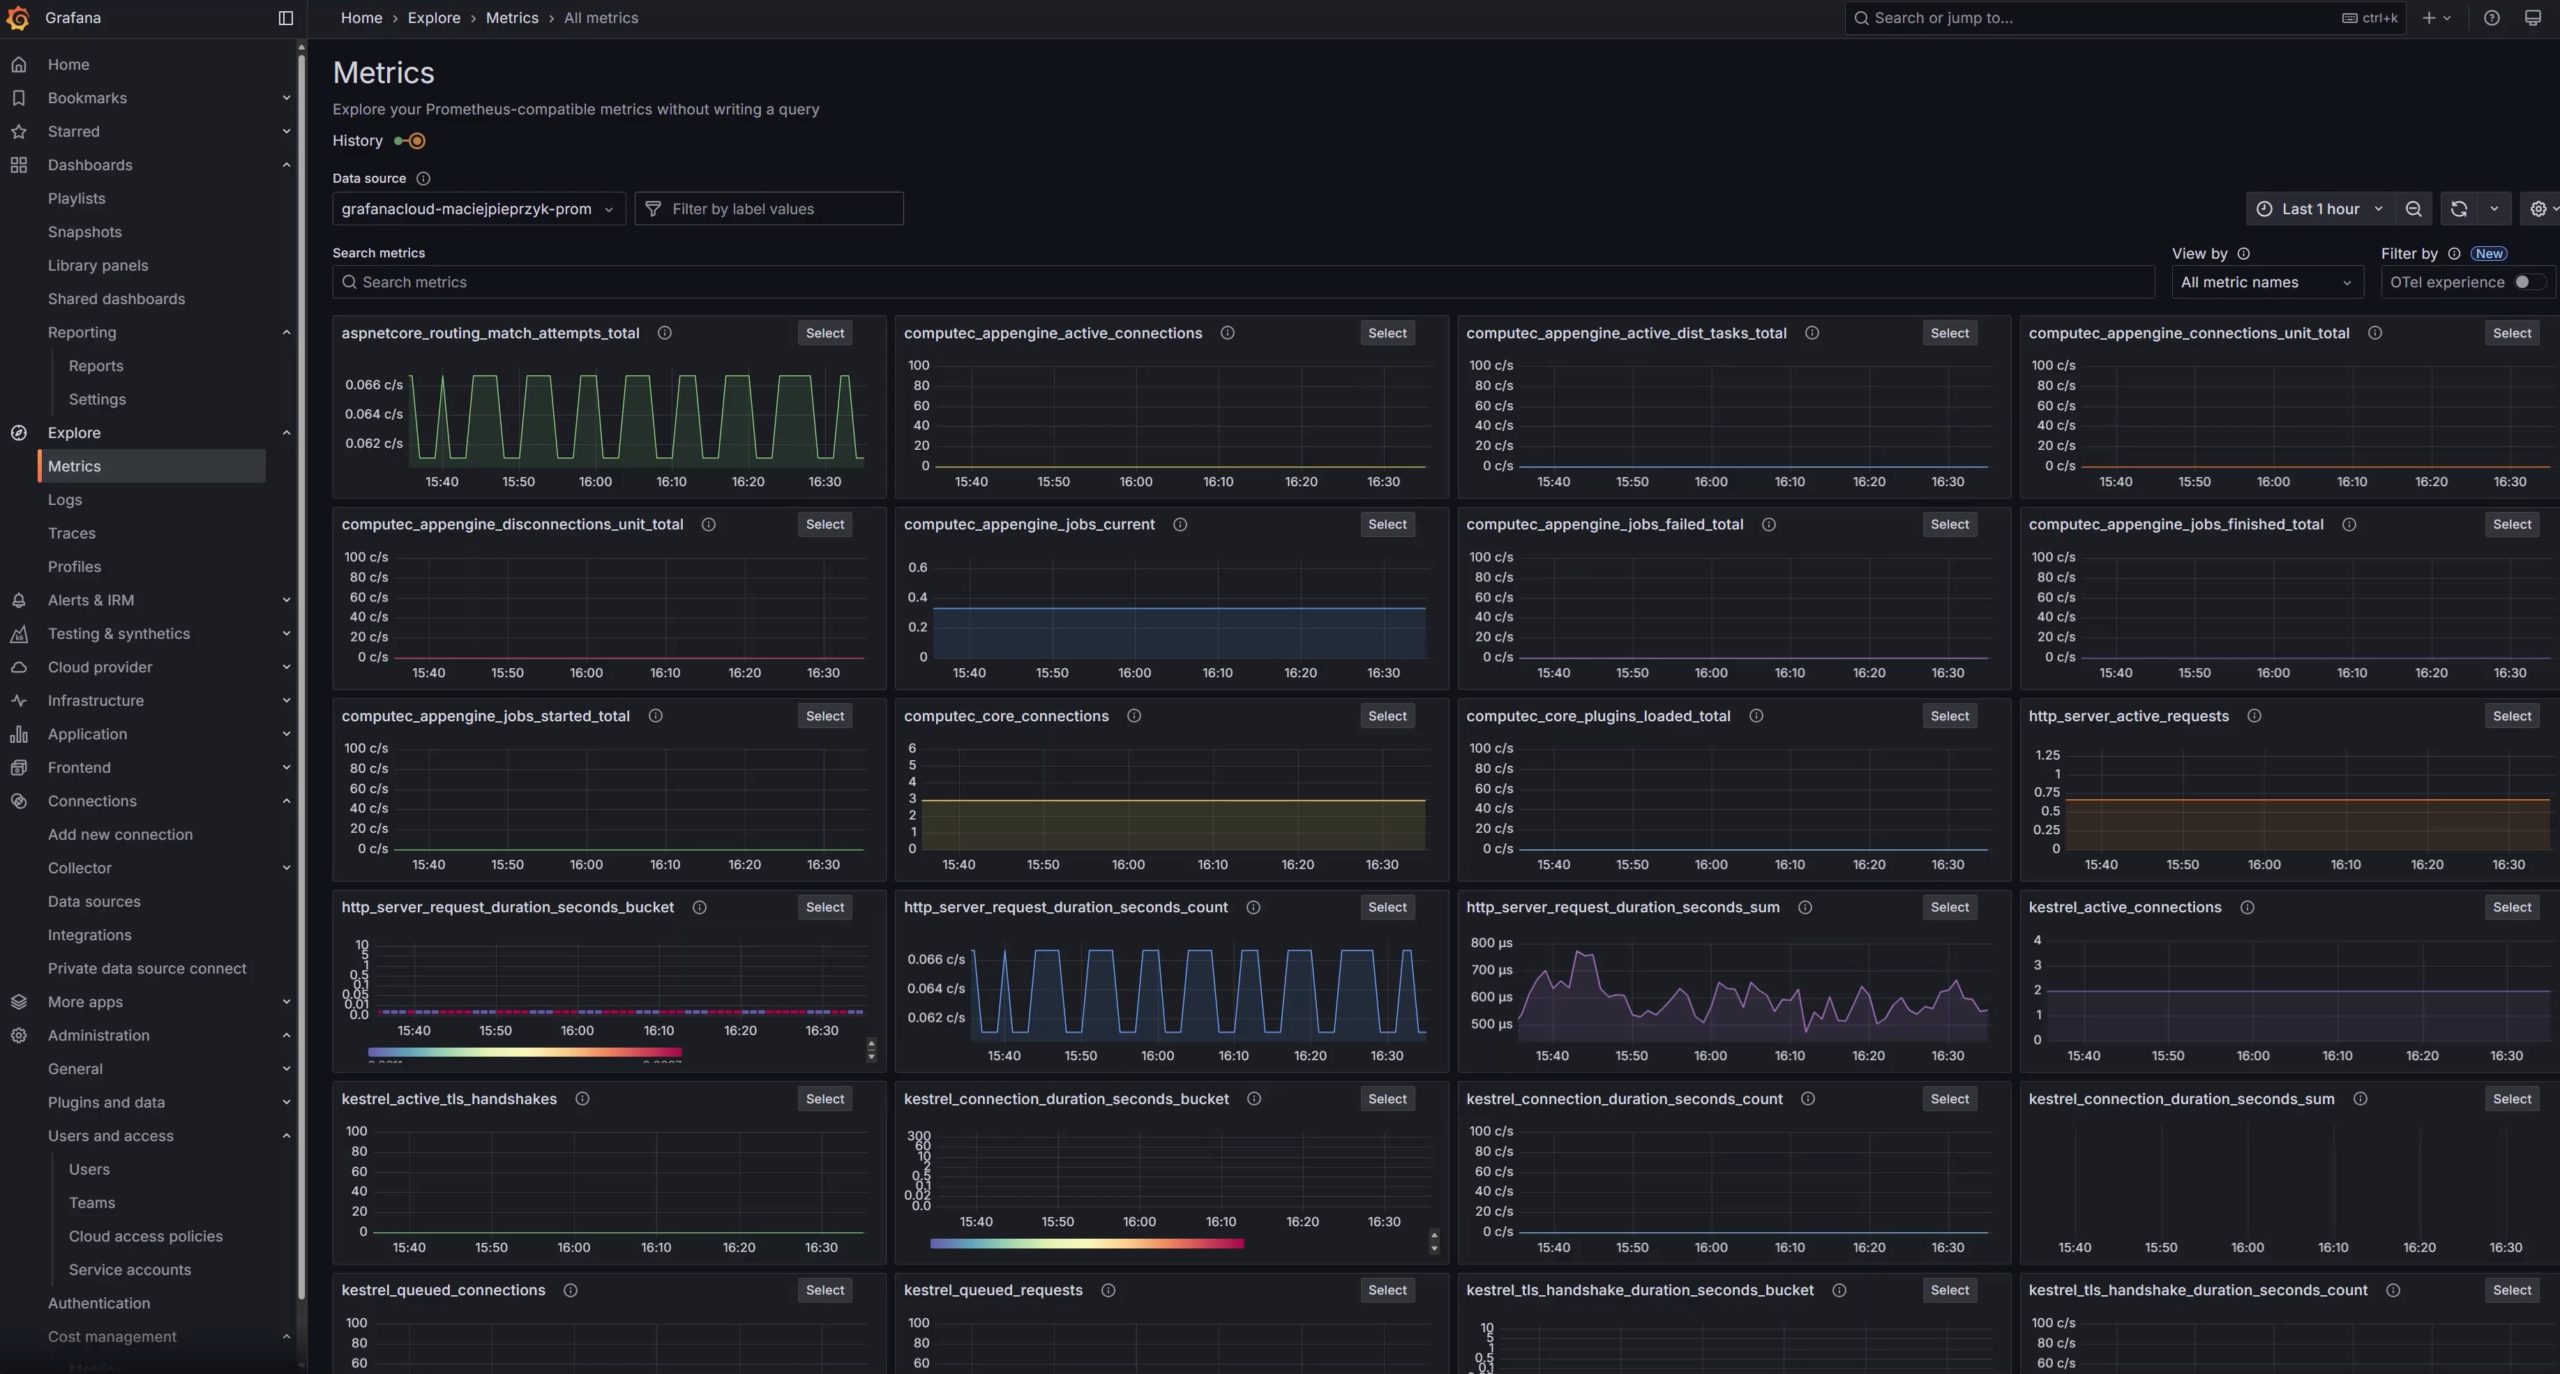
Simplified Monitoring and Visualization: Observability vendors offer a powerful and user-friendly platform for visualizing your telemetry data through customizable dashboards. This makes it easy to understand complex information at a glance and share insights across your team.
Scalability and Flexibility: Grafana’s open-source version can be deployed on-premises for free. Grafana Cloud is a fully managed platform that scales to meet your needs. You can easily monitor growing SAP Business One and CompuTec solution deployments without worrying about managing the underlying infrastructure. Grafana Cloud even provides a generous free tier!
Getting Started with CompuTec AppEngine and Grafana
Integrating your CompuTec AppEngine applications with Grafana Cloud is designed to be straightforward. Our comprehensive documentation will guide you through the simple configuration process, allowing you to start quickly collecting and visualizing your data.
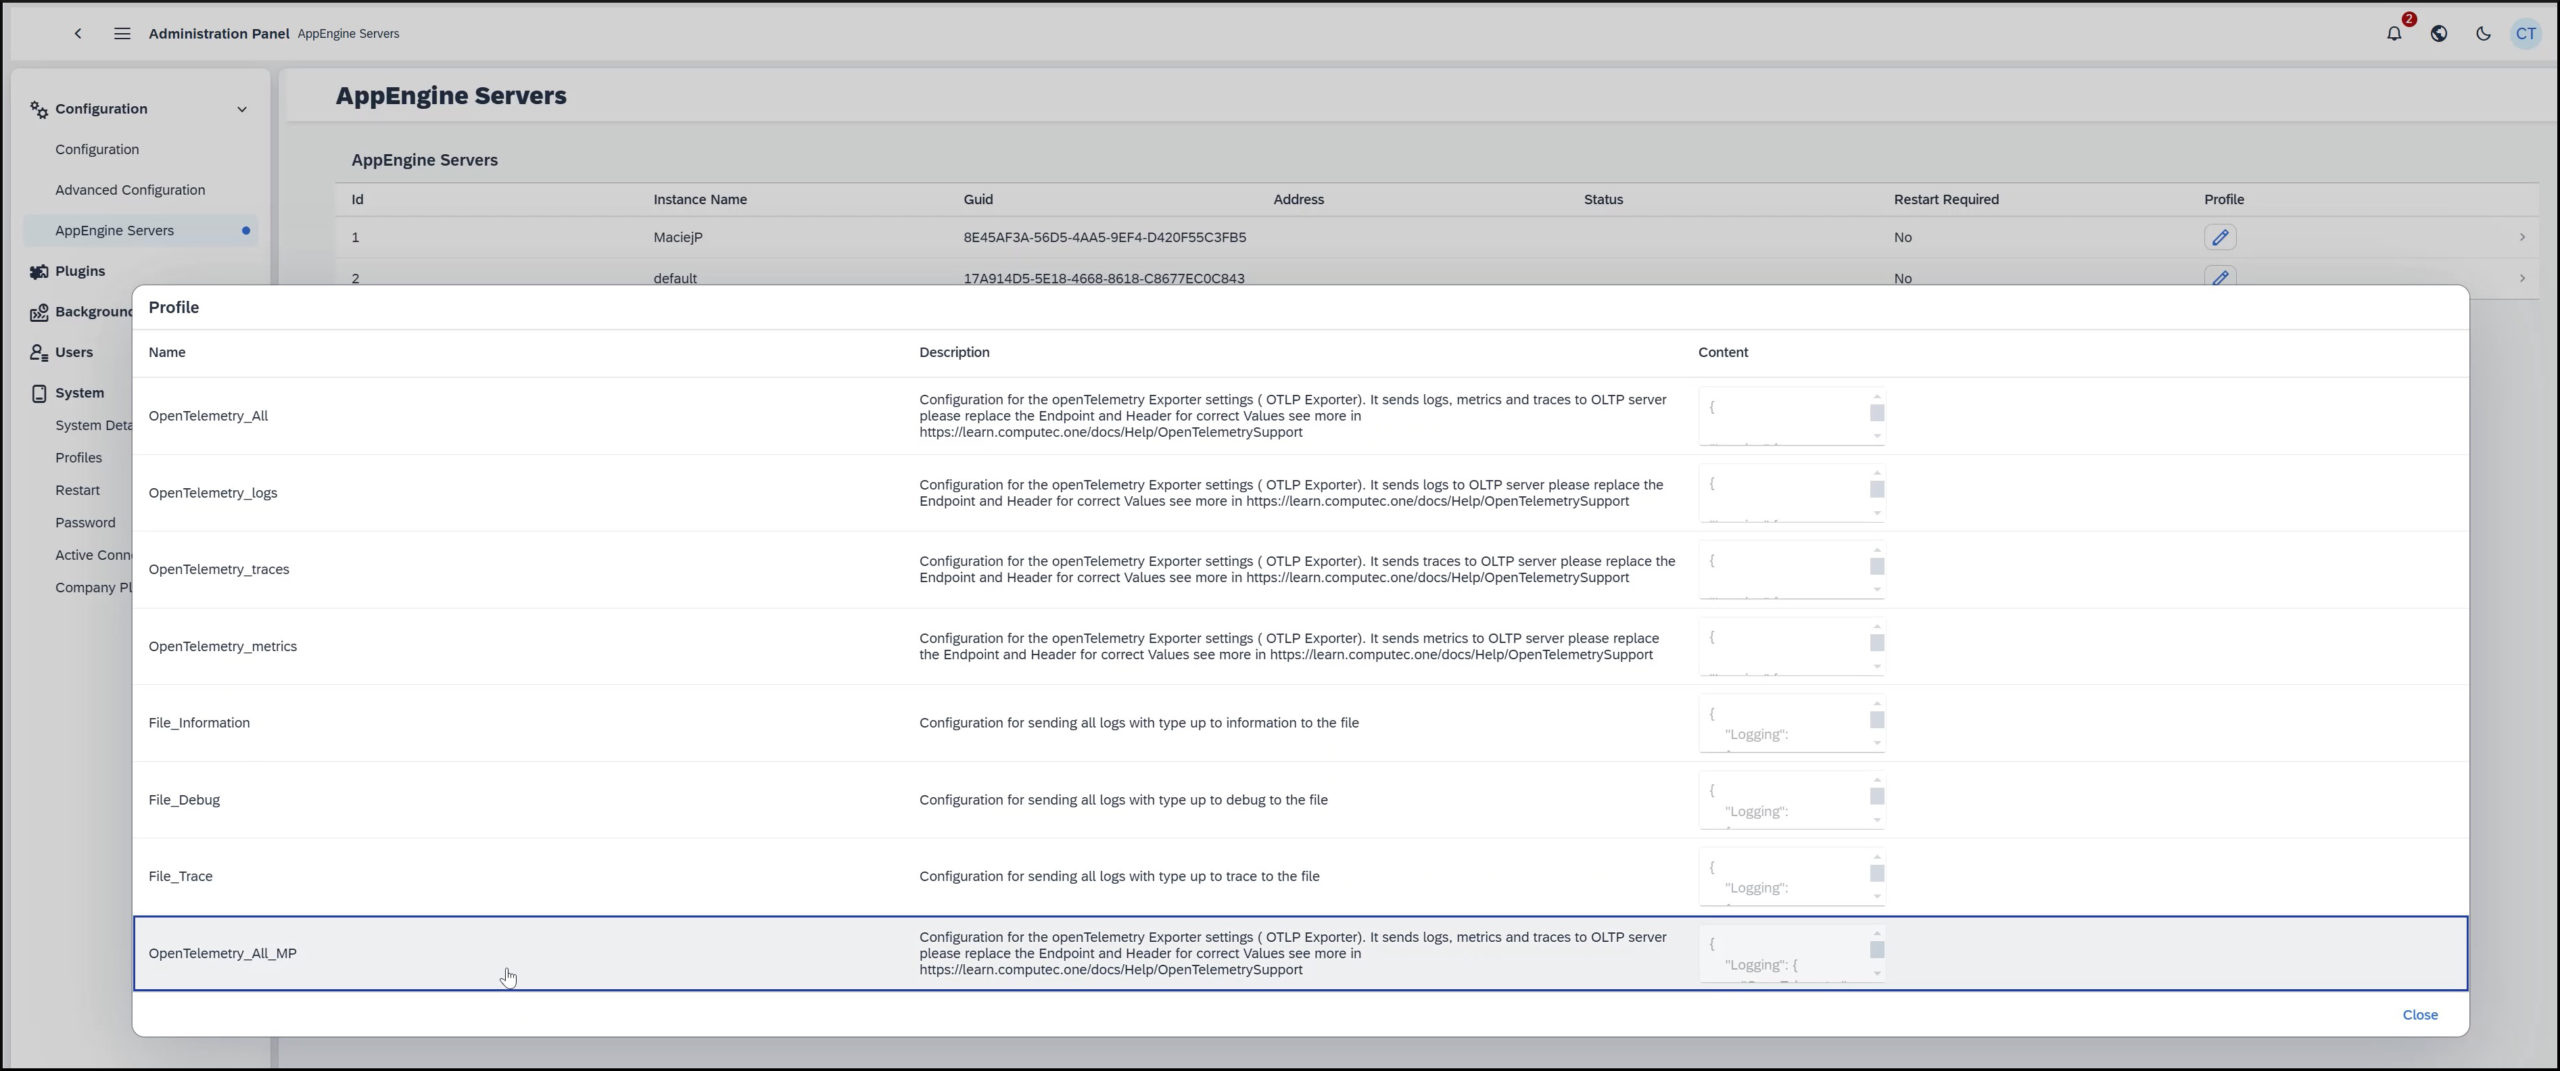
AppEngine allows you to define, edit, and utilize multiple OpenTelemetry profiles. For example, you might wish to set up separate OpenTelemetry profiles for platform monitoring, tenant-specific performance, or detailed debugging. This enables you to tailor your monitoring strategy to specific needs, providing granular insights into different aspects of your application landscape.
You can also see how OpenTelemetry is configured in CompuTec AppEngine in this short demonstration video.
By leveraging the power of multiple OpenTelemetry profiles in CompuTec AppEngine, you can move beyond basic monitoring and gain actionable intelligence that drives better performance, faster issue resolution, and ultimately, greater business value from your applications.


